✨ Core Features
Interactive Spending Dashboard
Dedicated, mobile-friendly analytics dashboard (/spending) with responsive ECharts visualizations, KPI metrics, and dark theme design.
Executive Cash Flow KPIs
Instant metrics for Total Net Spending, Total Inflow Income, Net Savings, and Savings Rate % across any selected calendar year.
Monthly Spend Trends
Interactive monthly spending breakdown charts with dynamic monthly average benchmarking and seasonal distribution insights.
Category Groups & Donut Charts
Visual group distribution breakdown with percentage of total spend and Year-over-Year (YoY) percentage comparisons against the previous year.
Ranked Category Breakdown
Searchable, itemized category table with real-time filtering, subcategory ranking, and detailed spending totals.
Dynamic Data Freshness & Sync
Real-time synchronization with live Monarch Money data via the API engine, complete with visual freshness indicators.
📸 Spending Report Screenshots
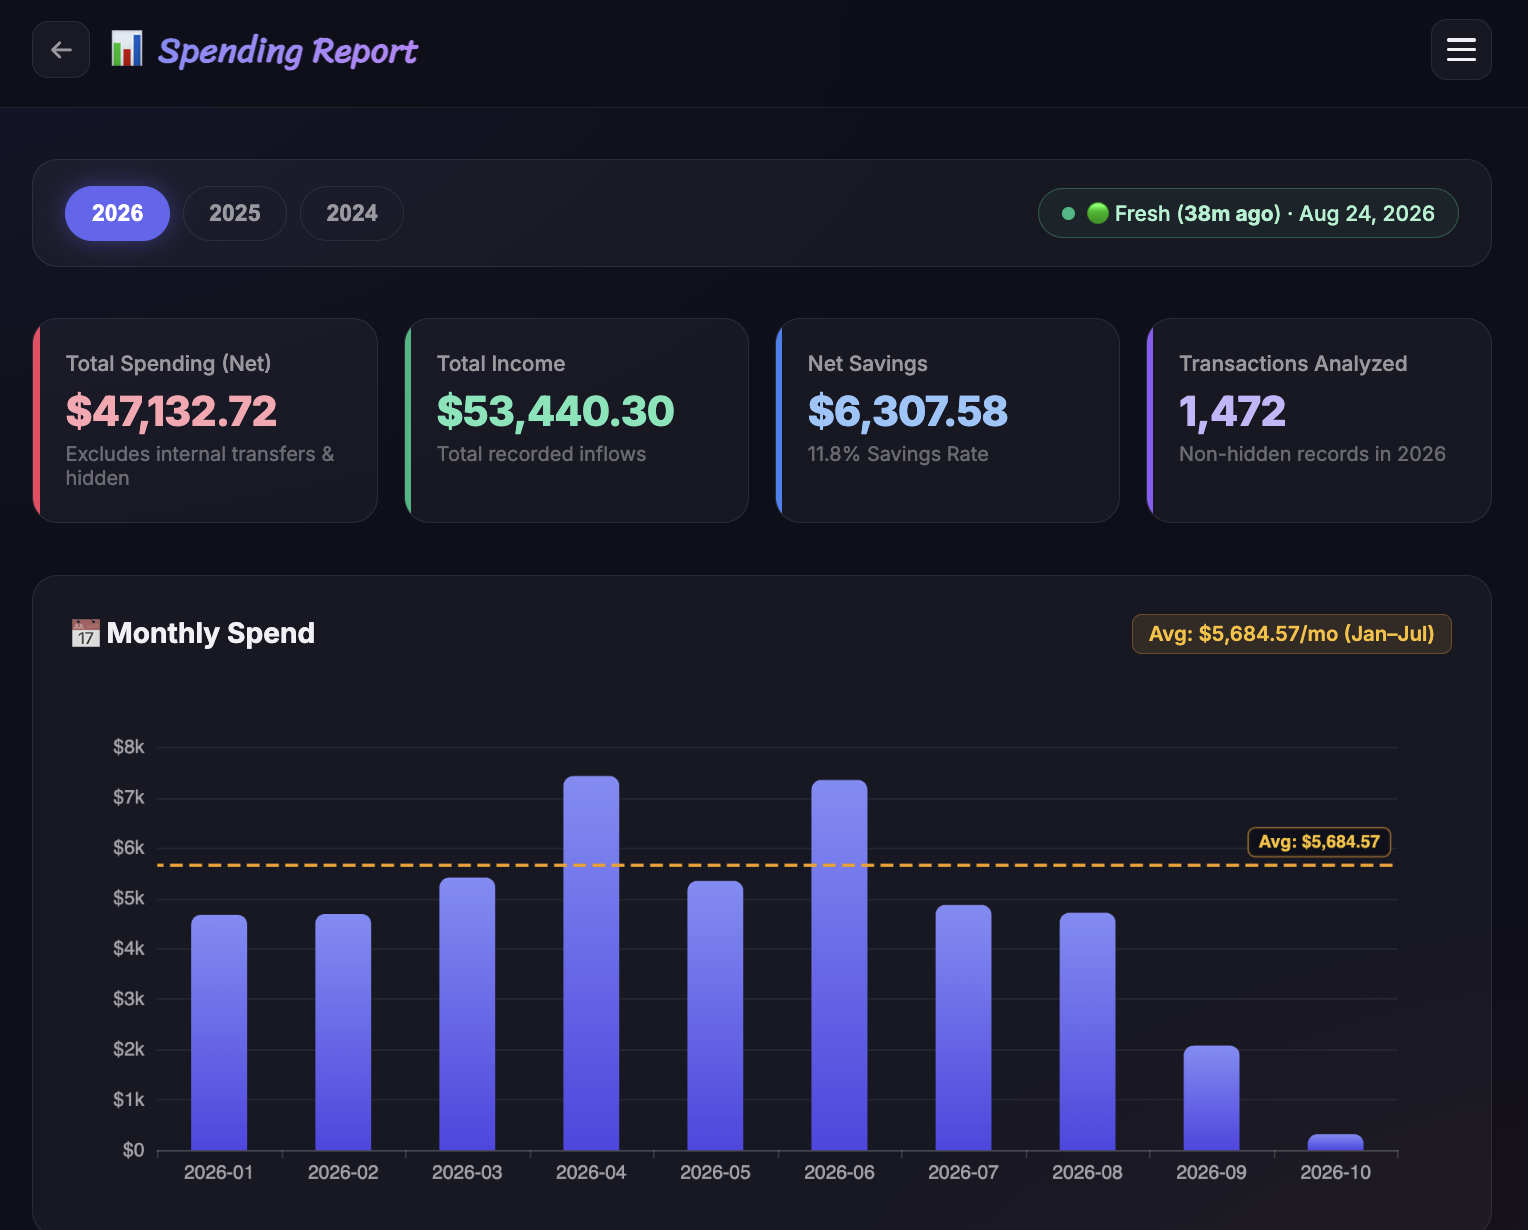
Executive Cash Flow & Monthly Breakdown
KPI metrics for Net Spending, Inflow, and Savings Rate % alongside interactive monthly trend charts.
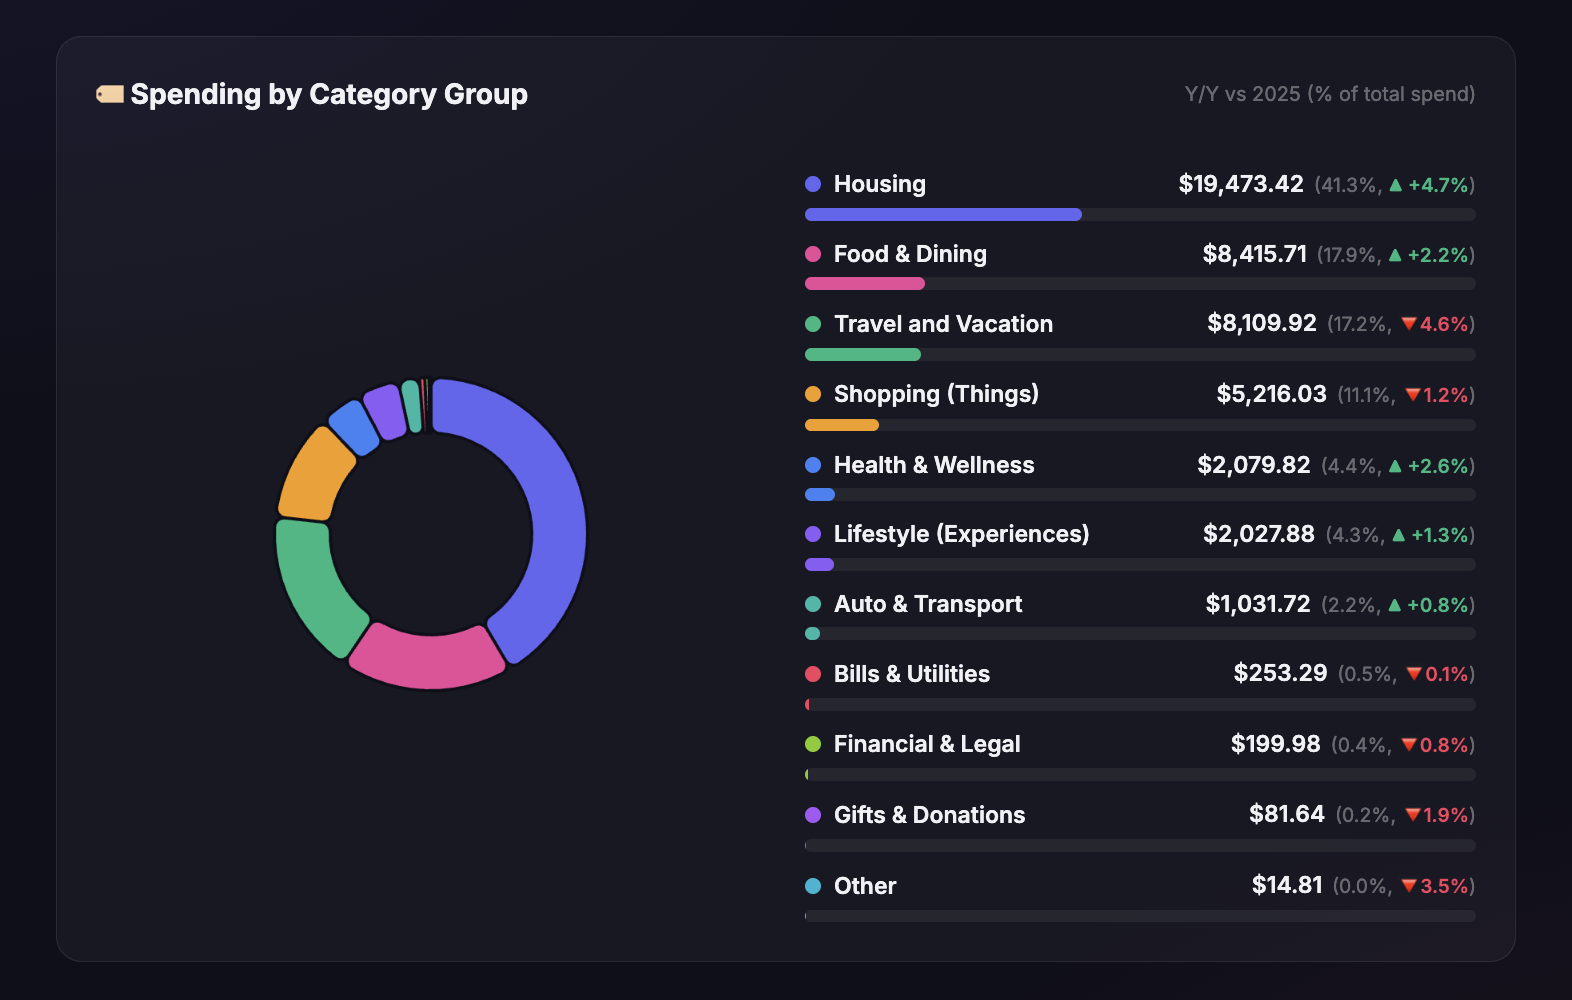
Category Distribution & Itemized Table
Visual group spend donut charts with YoY percentage comparisons and itemized category breakdown table.